Forecasting Recessions
Note: This post is NOT financial advice! This is just a fun way to explore some of the capabilities R has for importing and manipulating data.
John Hussman has a Recession Warning Composite that I am attempting to replicate/improve. The underlying data seems to be easy enough to get from FRED using the quantmod package in R. I don’t quite understand the index Hussman is using for commercial paper, so I used the ‘3-month AA financial commercial paper index’ from FRED.
The PMI index requires scraping a table from the ISM website, which is easy enough to do with the XML package.
Here’s my code so far, please leave a comment and let me know what you think:
library(quantmod)
set.seed(42)

#################################################
# 1. Credit spreads
#################################################

getSymbols('CPF3M', src='FRED') #3-Month Financial Commercial Paper
#> [1] "CPF3M"
getSymbols('GS3M', src='FRED') #3-Month Treasury
#> [1] "GS3M"
CS <- na.omit(CPF3M-GS3M)

#6 month increase
CS <- na.omit(CS-Lag(CS,6))
names(CS) <- 'CS'

#################################################
# 2. Stock Prices
#################################################
getSymbols('^GSPC')
#> [1] "GSPC"
SP500 <- Cl(to.monthly(GSPC))

#Re-index to start of month
library(lubridate)
index(SP500) <- as.Date(ISOdate(year(index(SP500)),month(index(SP500)),1))

#6 month increase
SP500 <- na.omit(SP500-Lag(SP500,6))
names(SP500) <- 'SP500'

#################################################
# 3. ISM Purchasing Managers index
#################################################

#A. PMI
library(RCurl)
library(XML)
library(xts)

#Scrape data from the website
url <- 'https://web.archive.org/web/20131224165222/http://www.ism.ws/ISMReport/content.cfm?ItemNumber=10752'
html_data <- getURL(url)
rawPMI <- readHTMLTable(html_data)
PMI <- data.frame(rawPMI[[1]])
names(PMI)[1] <- 'Year'

#Reshape
library(reshape2)
PMI <- melt(PMI,id.vars='Year')
names(PMI) <- c('Year','Month','PMI')
PMI$PMI <- as.numeric(as.character(PMI$PMI))
PMI <- na.omit(PMI)

#Convert to XTS
numMonth <- function(x) {
    months <- list(jan=1,feb=2,mar=3,apr=4,may=5,jun=6,jul=7,aug=8,sep=9,oct=10,nov=11,dec=12)
    x <- tolower(x)
    sapply(x,function(x) months[[x]])
}
PMI$Month <- numMonth(PMI$Month)
PMI$Date <- paste(PMI$Year,PMI$Month,'1',sep='-')
PMI$Date <- as.Date(PMI$Date,format='%Y-%m-%d')
PMI <- xts(PMI$PMI,order.by=PMI$Date)
names(PMI) <- 'PMI'

#B. Employment
getSymbols('PAYEMS',src='FRED') #Non-farm employment
#> [1] "PAYEMS"
PAYEMS <- na.omit((PAYEMS-Lag(PAYEMS,12))/Lag(PAYEMS,12)) #12 month increase
names(PAYEMS) <- 'PAYEMS'

#################################################
# 4. Yield Curve
#################################################
getSymbols('GS10',src='FRED') #10-year Treasury
#> [1] "GS10"
YC <- na.omit(GS10-GS3M)
names(YC) <- 'YC'

#################################################
# Put it all together
#################################################

P.A <-(CS>0) & #1. Credit spreads widening over 6 months
                    (SP500<0) & #2. Stocks falling over 6 months
                    (PMI<50) &      #3. PMI below 50
                    (YC<2.5)        #4. 10 year vs 3 year yields below 2.5%
P.B <- (CS>0) & #1. Credit spreads widening over 6 months
                    (SP500<0) & #2. Stocks falling over 6 months
                    (PMI<54) &      #3. PMI below 54
                    (PAYEMS<1.3) &  #3.B 1Y employment growth below 1.3%
                    (YC<3.1)        #4. 10 year vs 3 year yields below 2.5%

P.Rec <- P.A | P.B
names(P.Rec) <- 'P.Rec'
P.Rec$P.Rec <- as.numeric(P.Rec$P.Rec)
Plots
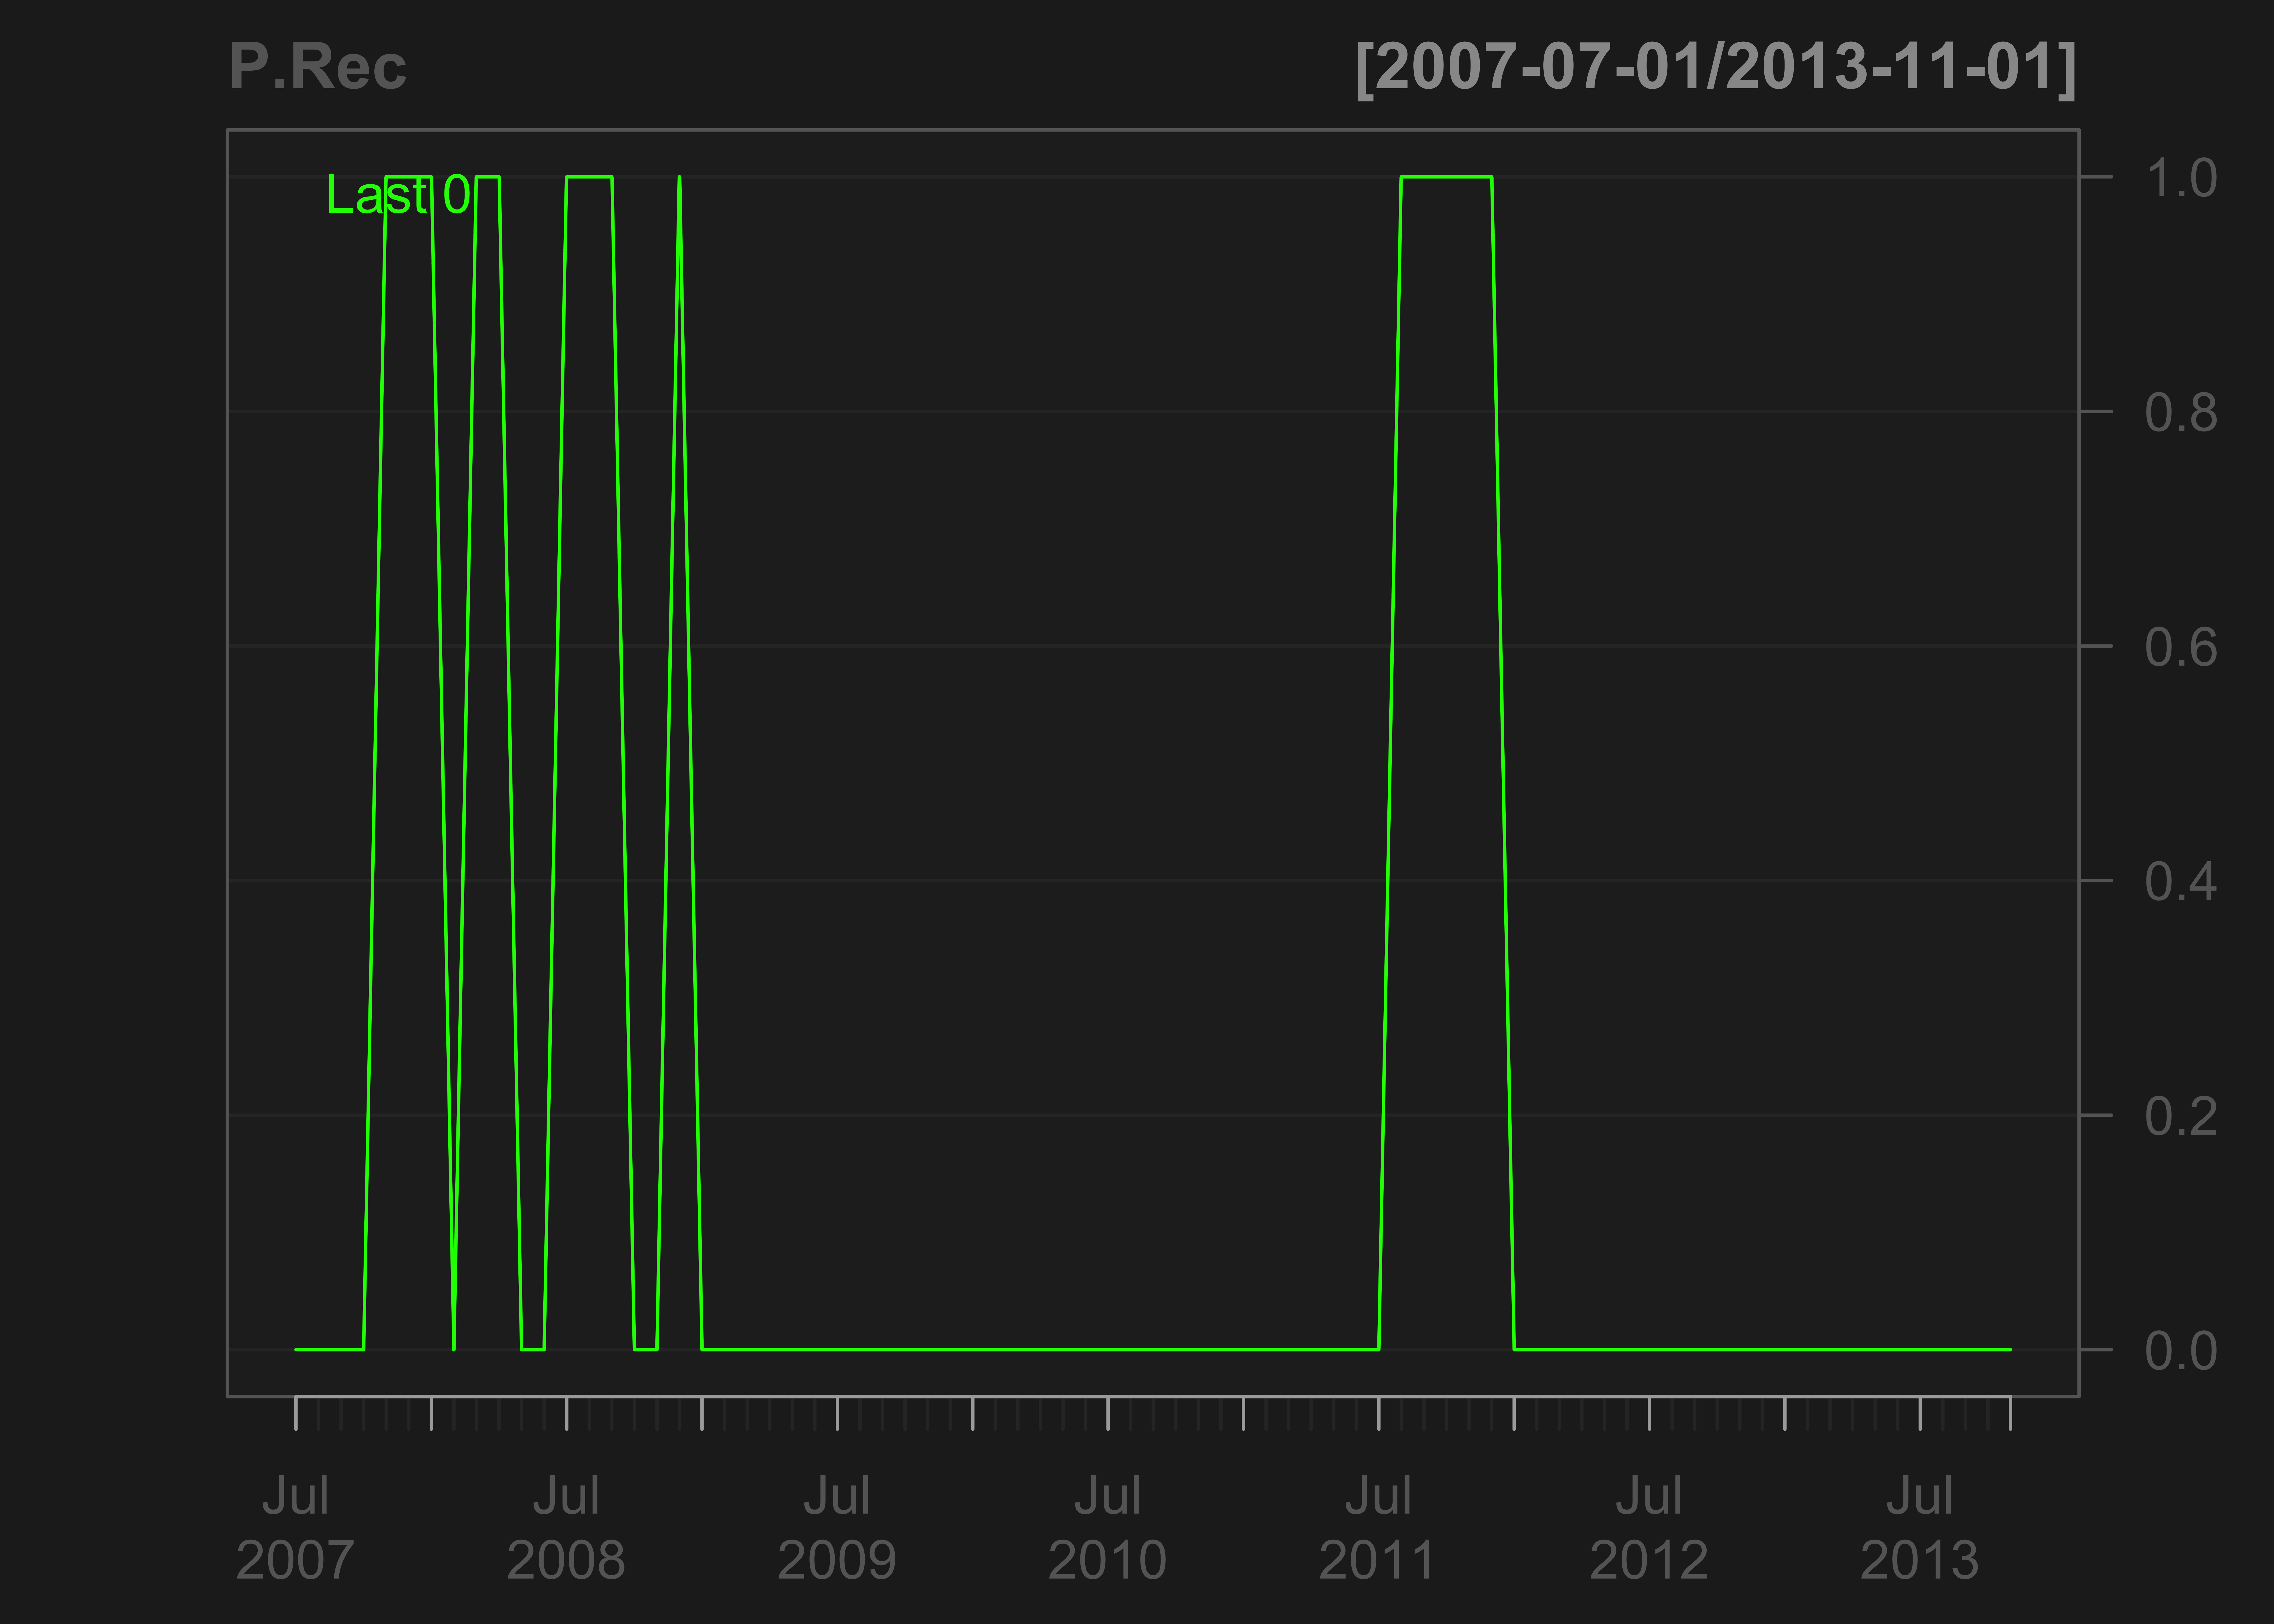
chartSeries(P.Rec)

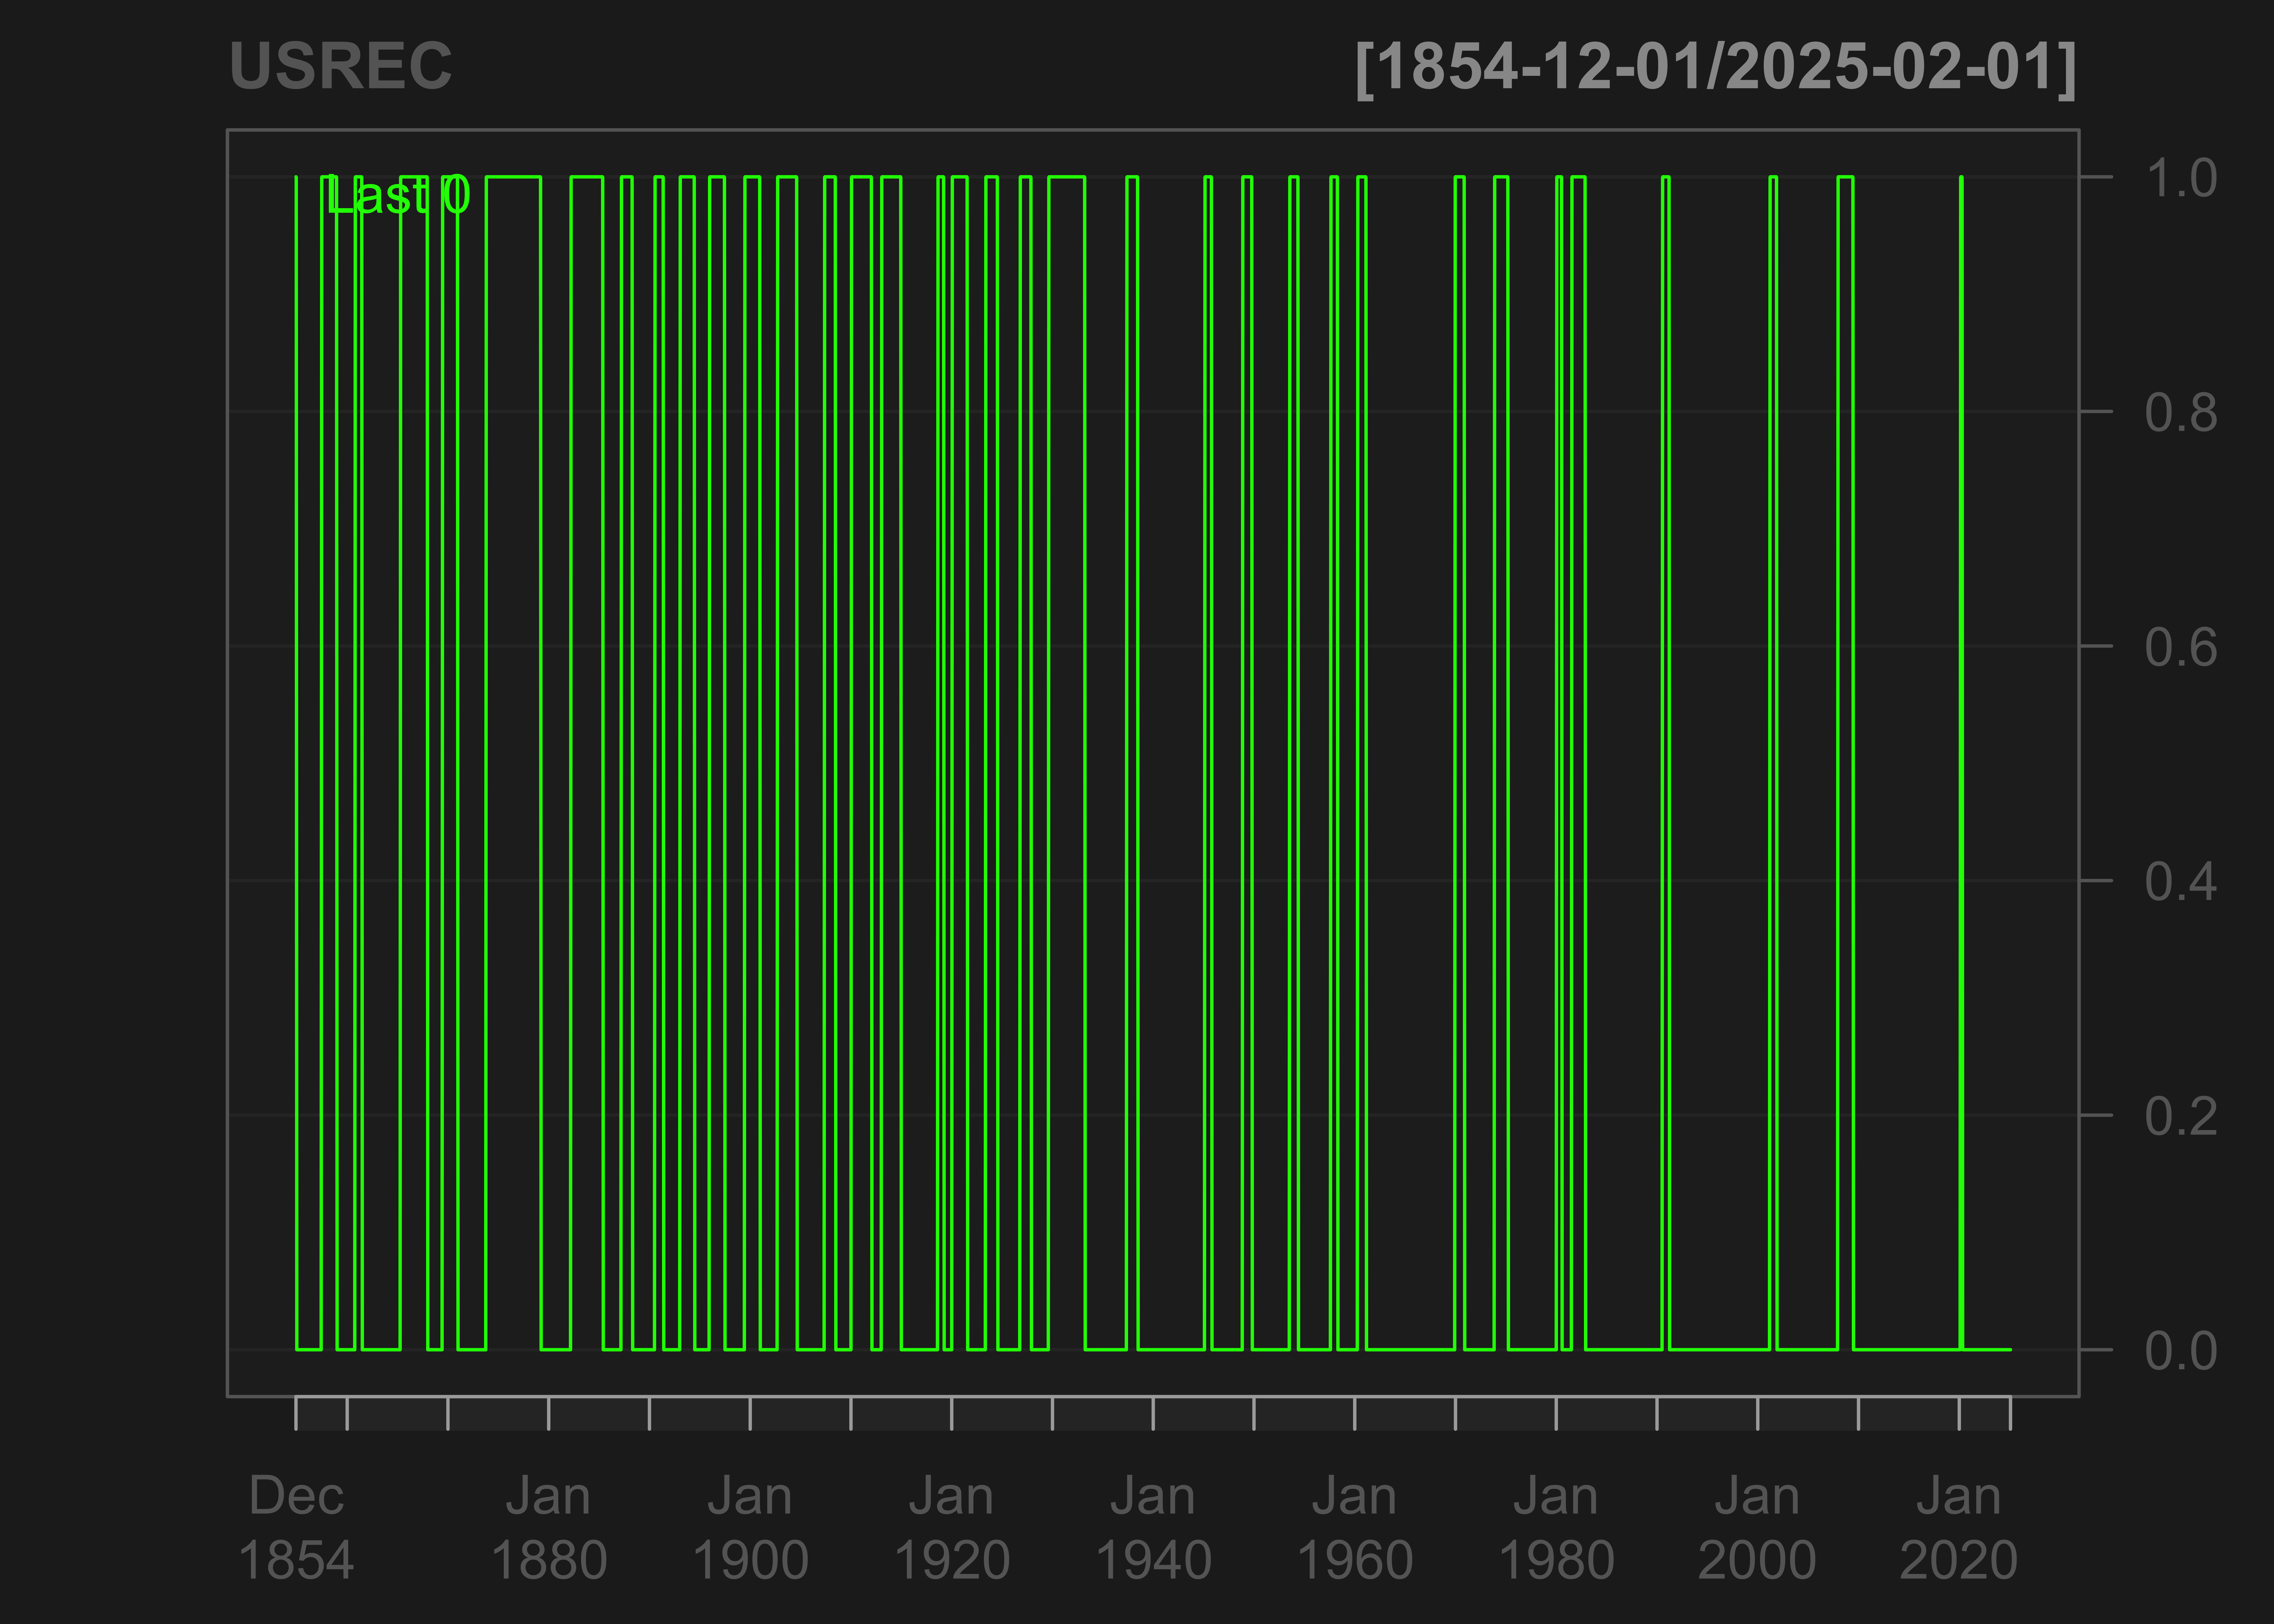
getSymbols('USREC',src='FRED')
#> [1] "USREC"
chartSeries(USREC)

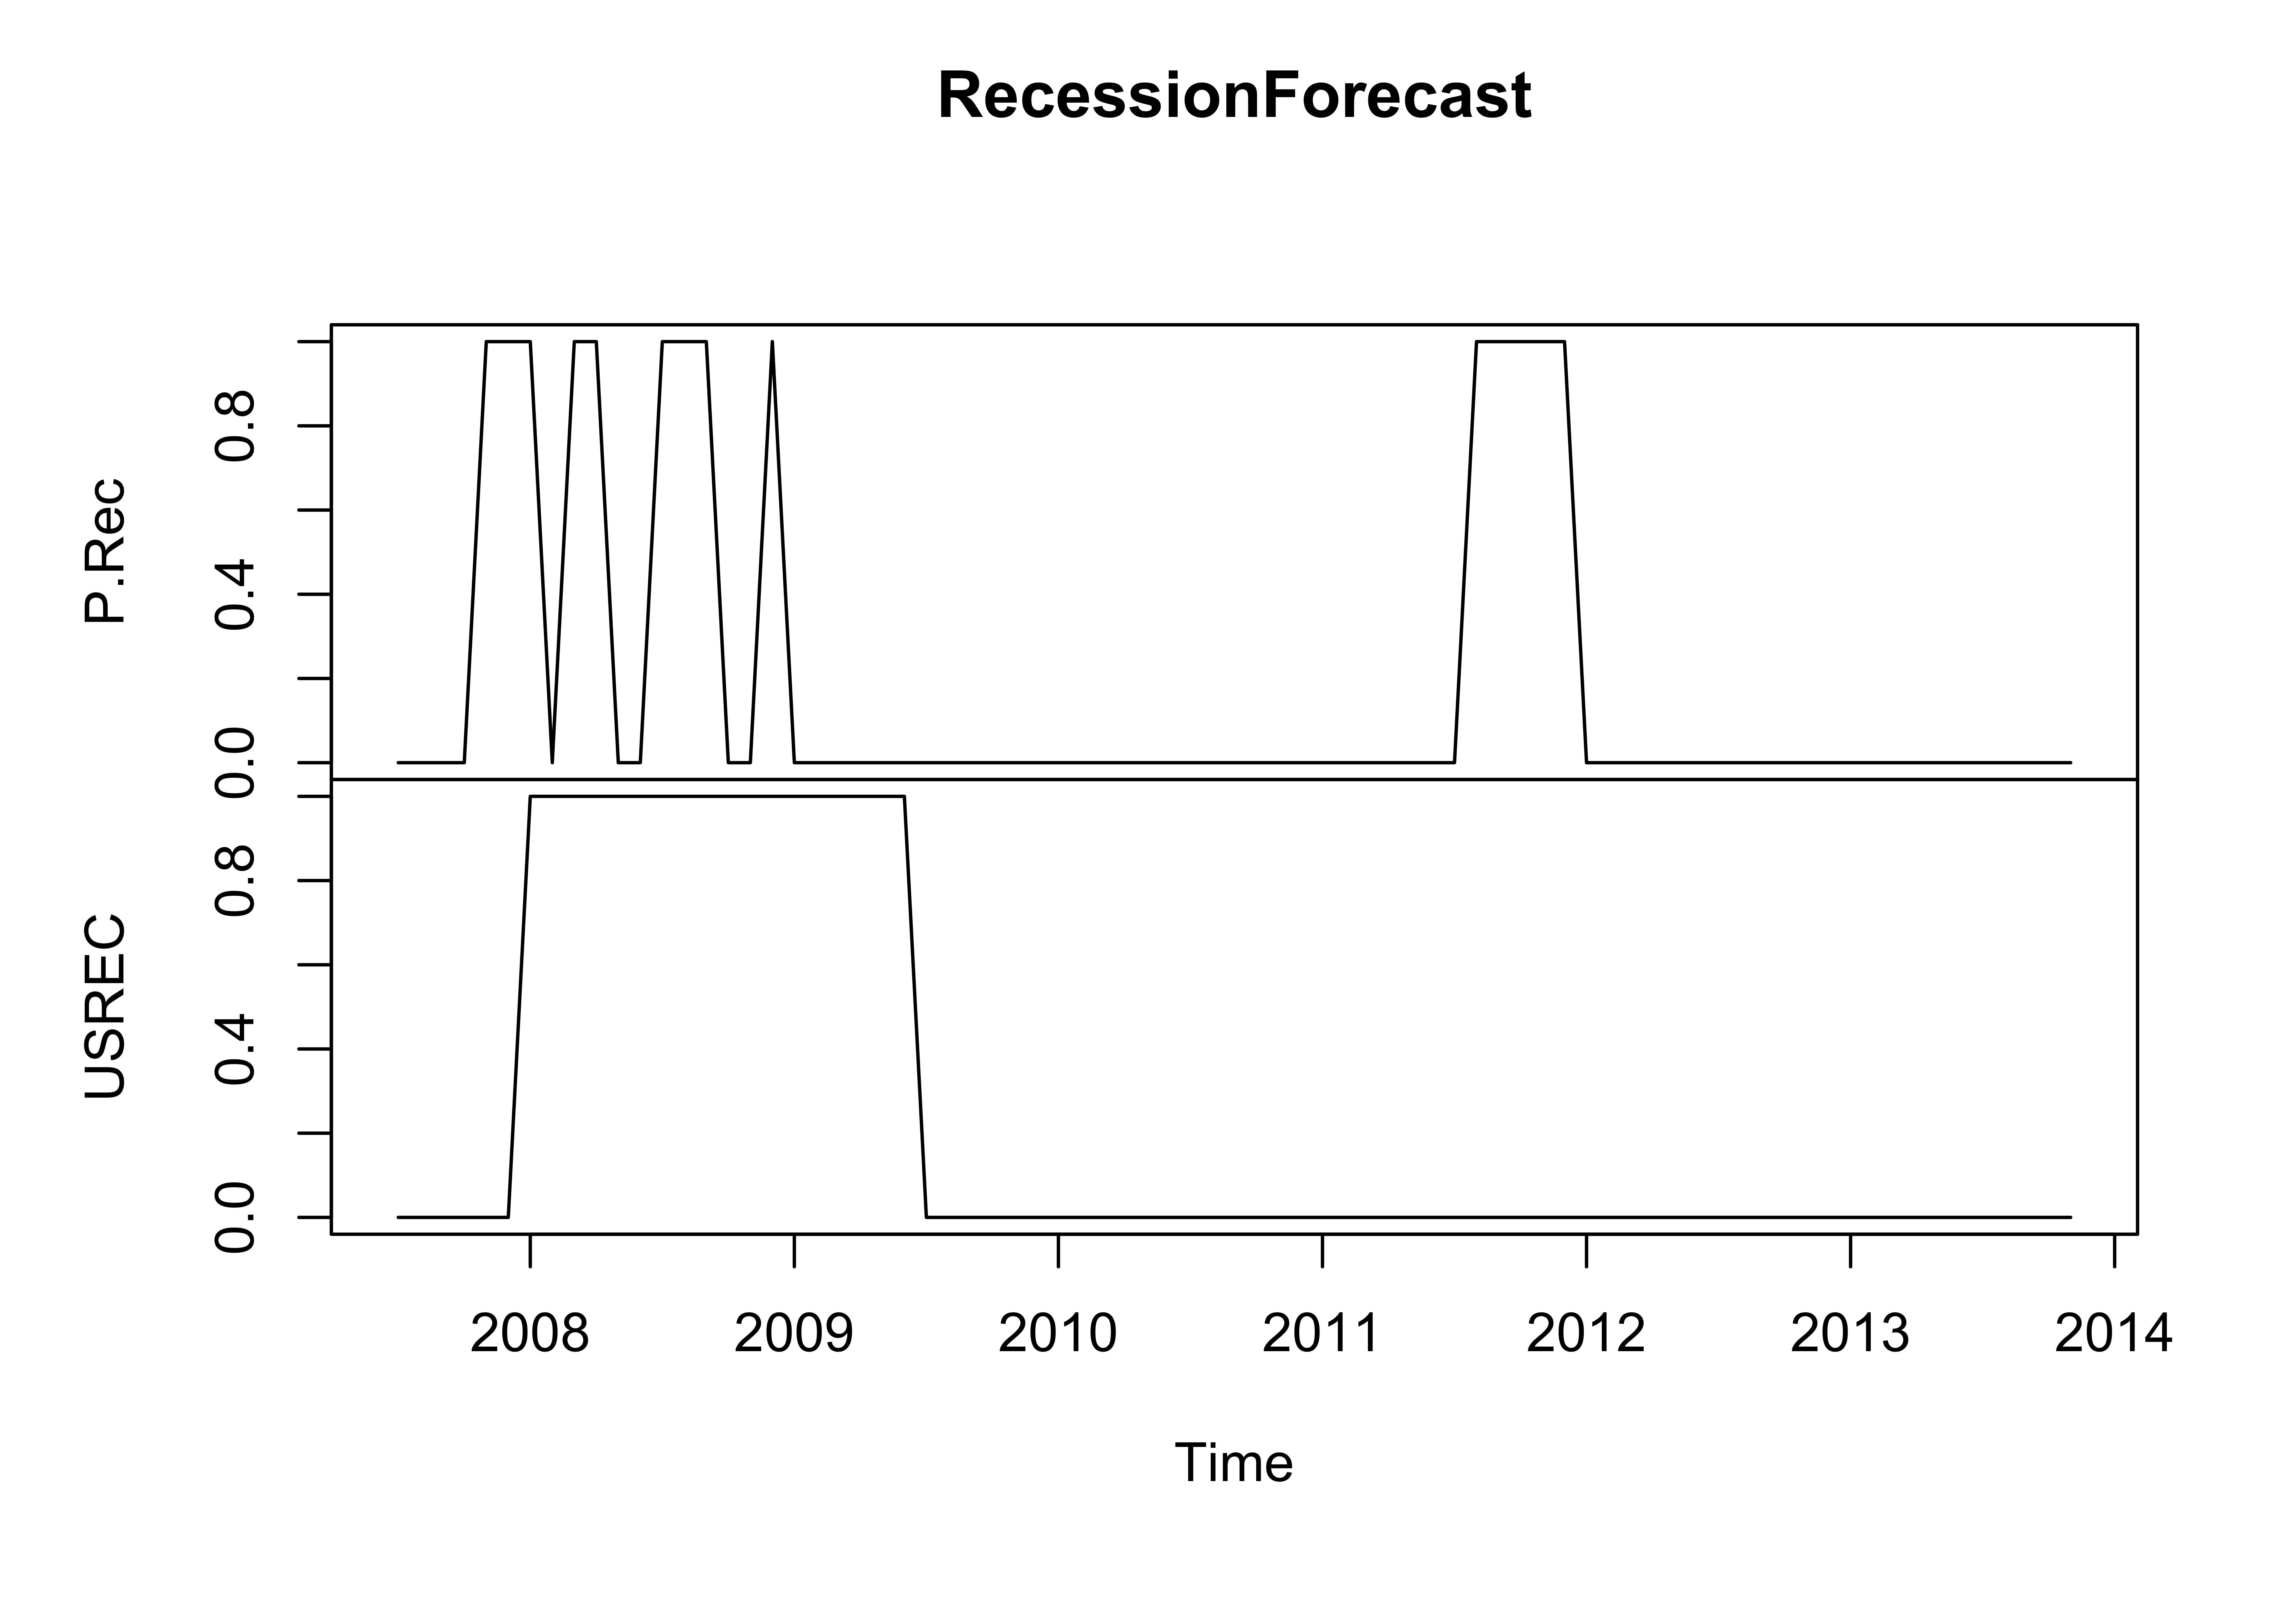
RecessionForecast <- na.omit(cbind(P.Rec,USREC))
start <- min(index(RecessionForecast))
RecessionForecast <- ts(RecessionForecast,frequency=12,start=c(year(start),month(start)))
plot(RecessionForecast)
